Why us?
			The ability to interactively visualize and explore high dimensional data is the key to
			
			better understanding hidden patterns and the possible mechanisms driving complex dynamics.
			
Each individual research project will require a tailor-made, interactive visualization application.
We provide:
![]()
![]()
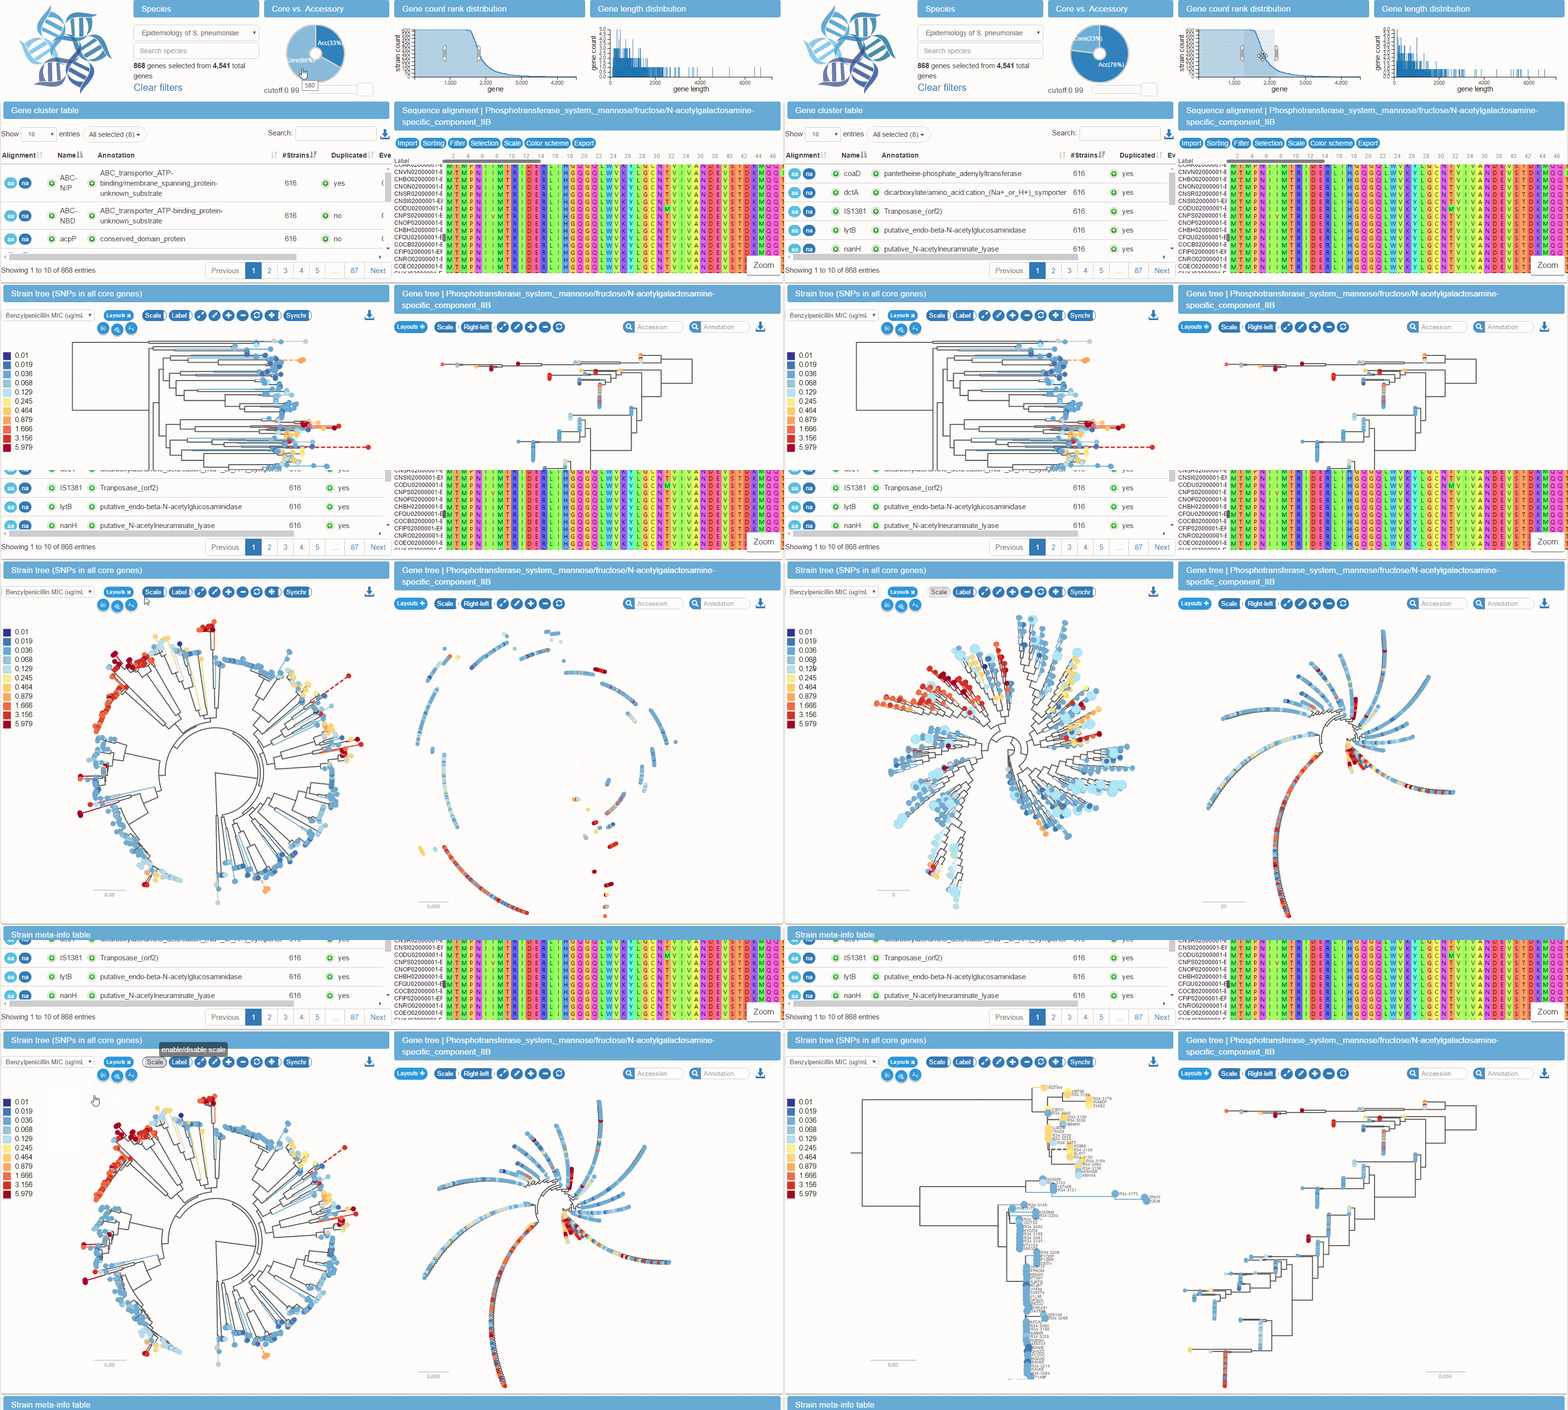
						Click video: check a use-case example for pathogen genomic surveillance and epidemiological investigations (ongoing project)
						
						
![]()
![]()
						
						Check our
						successful project published in NAR
						
						Showcase: the beauty, power, and utility of of the panX visualization
						
							Interested in use-cases in other areas, or a customized visualization solution for your project?
							Please feel free to contact us.
						

© copyright 2018
             			
             			PathoVis
All rights reserved.